Discharge time series
Split annually
from warsa.timeseries.timeseries import split_annually
import pandas as pd
pd.options.display.max_rows = 4  # limit the number of printed rows
The function split_annually has a series (not a data frame) as input parameter with datetime as index and discharges as values. It return a dictionary of annual time series with a tuple (Timestamp from, Timestamp to) as key and the annual series as value. Example:
d = split_annually(sr)  # dictionary
for k, v in d.items():
    print(k, '\n', v, '\n============================================================')
Output:
(Timestamp('1979-01-01 00:00:00'), Timestamp('1979-12-31 23:59:59.999999'))
 Date
1979-11-01 07:45:00    0.015055
1979-11-01 08:00:00    0.030073
                         ...
1979-12-31 23:30:00    0.551233
1979-12-31 23:45:00    0.551172
Name: Q, Length: 5654, dtype: float64
============================================================
...
(Timestamp('2014-01-01 00:00:00'), Timestamp('2014-12-31 23:59:59.999999'))
 Date
2014-01-01 00:00:00    0.618027
2014-01-01 00:15:00    0.618112
                         ...
2014-12-31 23:30:00    0.529134
2014-12-31 23:45:00    0.529143
Name: Q, Length: 34547, dtype: float64
============================================================
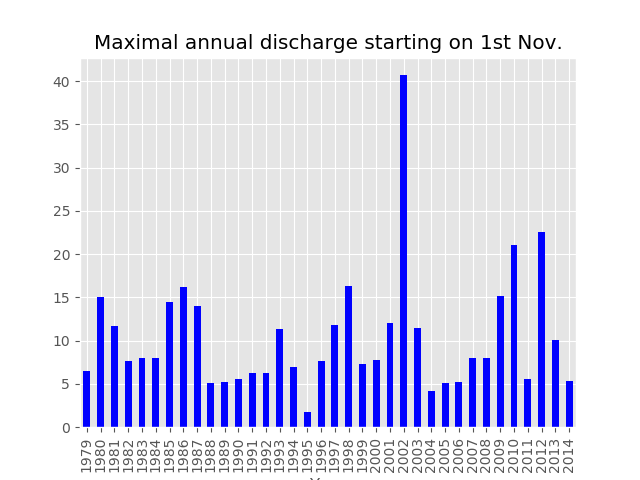
If not otherwise stated, the year starts on 1st January at 00:00:00. Hydrological years normally start in another month and at another time, e.g., on 1st November at 07:30am in Germany. In order to get maxima from 1st November 07:30 to 31th October before 07:30 of the next year:
d = split_annually(sr, beg_datetime=datetime.datetime(2000, 11, 1, 7, 30))  # dictionary
for k, v in d.items():
    print(k, '\n', v, '\n============================================================')
Note that the year is just a place holder. The function will split all years from YYYY-11-01 07:30:00 to (YYYY+1)-10-31 07:29:59.99999.
Output:
(Timestamp('1979-11-01 07:30:00'), Timestamp('1980-11-01 07:29:59.999999'))
 Date
1979-11-01 07:45:00    0.015055
1979-11-01 08:00:00    0.030073
                         ...
1980-11-01 07:00:00    0.512950
1980-11-01 07:15:00    0.512984
Name: Q, Length: 34618, dtype: float64
============================================================
...
(Timestamp('2014-11-01 07:30:00'), Timestamp('2015-11-01 07:29:59.999999'))
 Date
2014-11-01 07:30:00    0.395154
2014-11-01 07:45:00    0.395135
                         ...
2015-11-01 05:45:00    0.005440
2015-11-01 07:15:00    0.005430
Name: Q, Length: 32469, dtype: float64
============================================================
For maxima blocks of less than one year end_datetime can be defined. In the following example six months (November to April) annual series are obtained:
beg_datetime = datetime.datetime(2000, 11, 1, 7, 30)
end_datetime = datetime.datetime(2001, 5, 1, 7, 30)
d = split_annually(sr, beg_datetime=beg_datetime, end_datetime=end_datetime)
for k, v in d.items():
    print(k, '\n', v, '\n============================================================')
Output:
(Timestamp('1979-11-01 07:30:00'), Timestamp('1980-05-01 07:30:00'))
 Date
1979-11-01 07:45:00    0.015055
1979-11-01 08:00:00    0.030073
                         ...
1980-05-01 07:00:00    0.360897
1980-05-01 07:15:00    0.360817
Name: Q, Length: 17193, dtype: float64
============================================================
...
(Timestamp('2014-11-01 07:30:00'), Timestamp('2015-05-01 07:30:00'))
 Date
2014-11-01 07:30:00    0.395154
2014-11-01 07:45:00    0.395135
                         ...
2015-05-01 07:00:00    0.956652
2015-05-01 07:15:00    0.951989
Name: Q, Length: 17255, dtype: float64
============================================================
Annual statistics
Different annual statistics can be calculated using the annual split. Example:
d = split_annually(sr, beg_datetime=datetime.datetime(2000, 11, 1, 7, 30))  # dictionary
stats = [[k[0].year, v.max(), v.min(), v.mean(), v.std()] for k, v in d.items()]
df = pd.DataFrame(stats, columns=['Year', 'max', 'min', 'mean', 'std']).set_index('Year')
print(df)
Output:
            max       min      mean       std
Year
1979   6.514527  0.015055  0.714102  0.762369
1980  15.106880  0.301246  0.945218  1.375311
...         ...       ...       ...       ...
2013  10.074438  0.260308  0.681222  0.625493
2014   5.337633  0.005430  0.519517  0.641135
Plot:
df['max'].plot(kind='bar', color='b')
plt.show()